BLOG DETAILS

Sachin Pathak

Observability

26 November, 2025
Building Observability with Prometheus, Grafana and Loki
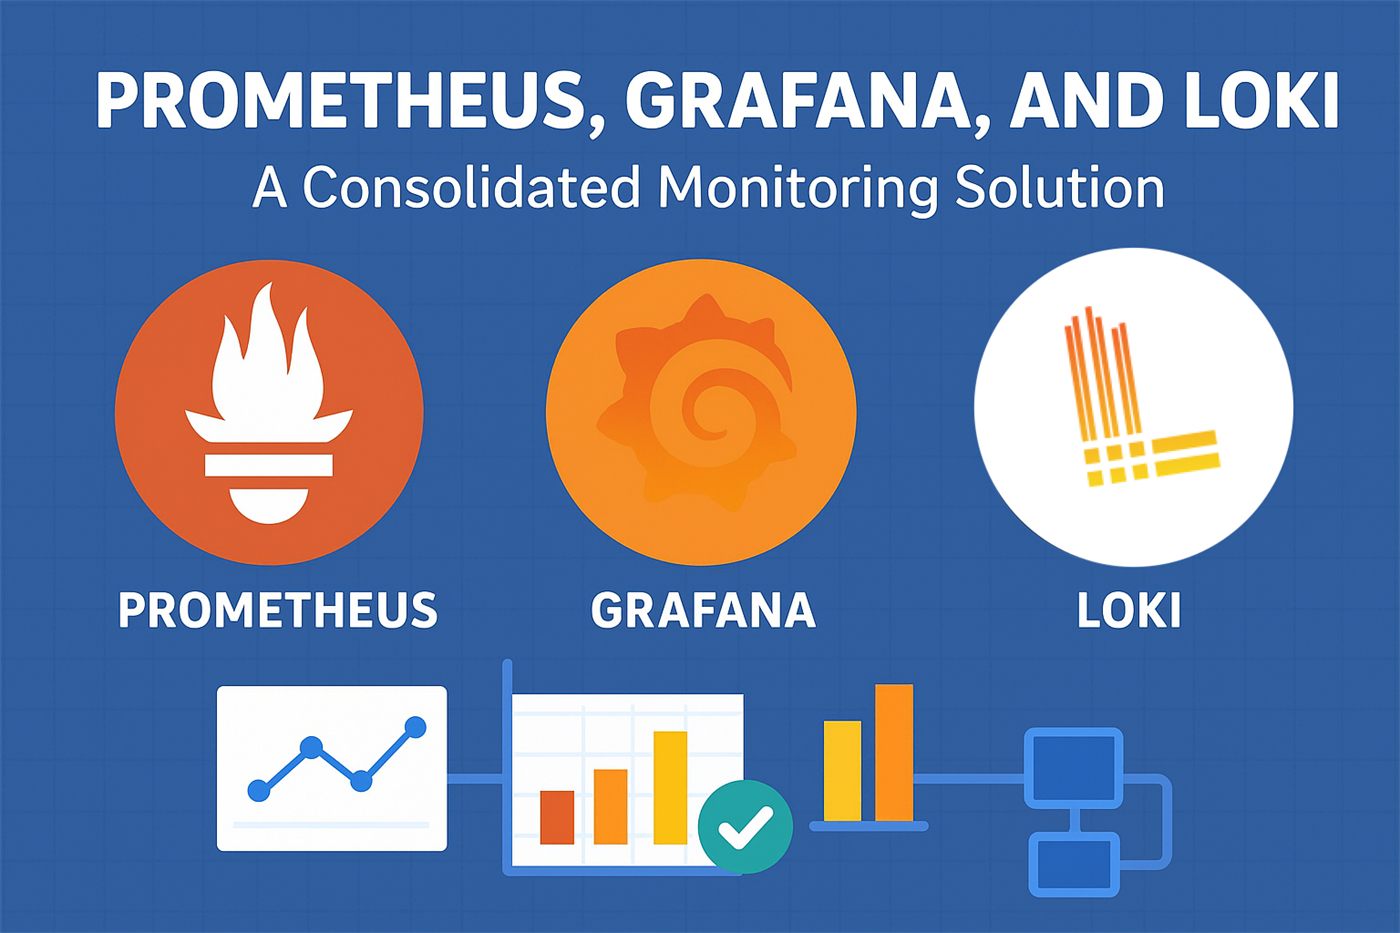
You cannot operate what you cannot see. Real observability is metrics, logs and traces working together — Prometheus, Grafana and Loki cover the first two beautifully.
Metrics with Prometheus
Prometheus scrapes time-series metrics from your services and infrastructure, with alerting rules for the conditions that actually matter.
Dashboards and logs in one pane
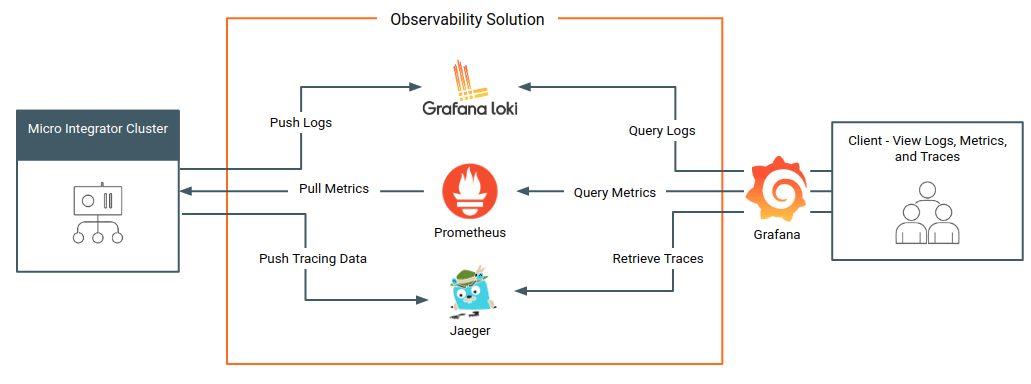
Grafana visualises Prometheus metrics and queries Loki for logs side by side — so a spiking graph links straight to the lines that caused it.
rate(http_requests_total{status=~"5.."}[5m]) > 0.05From dashboards to alerts
Alertmanager routes alerts to Slack or email with the right severity, so on-call hears about problems before users do.
Key Takeaways
- Metrics, logs and traces are the three pillars — you need all three.
- Prometheus scrapes metrics; Grafana turns them into actionable dashboards.
- Define SLOs and alert on user-facing symptoms, not every raw metric.
- Distributed tracing pinpoints latency across microservices.
- Structured logs with correlation IDs make incident triage far faster.
Wrapping Up
Metrics, logs and dashboards in one place turn firefighting into informed, fast response — and 99.8% uptime into a habit.
3 Comments +15
Harsh Tiwari
26 Apr 2026Alerting on symptoms instead of raw metrics cut our pager noise in half.
Shivani Pandey
27 Apr 2026Correlation IDs in structured logs make incident triage so much faster. Agree 100%.
Abhishek Anjana
29 Apr 2026The three-pillars framing is the clearest I’ve seen. Sharing with my team.